The primary value is that staff, based on their assigned duties, can access one or all tools and see the ‘what and where’ of response information for better planning, safety analysis, prevention programs, and service standards management. Units can easily check their recent performance and notice anomalies or errors in the records.
- Unit Performance assesses Turnout and Travel Time.
- Incident Performance assesses Alarm and Total Time.
The Performance Tools provide a dashboard to analyze the types and locations (or hotspots) of incidents within your critical areas.
New features are being phased - check out New features added to Performance Tools
Performance tools require CAD integration and are available in most Metro Intterra systems.
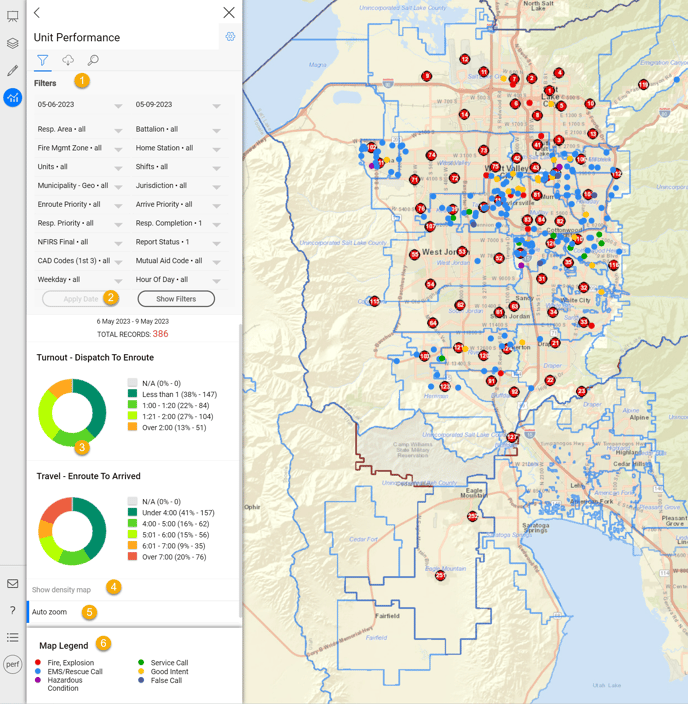
Using Performance Tools
To see dynamic Performance reports in Intterra, access the Unit and Incident Performance Tools from Tools Menu, usually available in the Performance Workspace.
- Adjust the parameters for a date range, stations, shifts, units, and call types, as needed for your analysis.
- If date filters were adjusted, select Apply Date (just below the filter choices).
- The report produced is in the form of donut charts with selectable slices. Select each slice to see the units that are represented by the slice show up on the map.
- Select Show density map to get a picture of the data clusters occurring within the timeframe chosen. TIP: This may be more useful if you adjust the All Incidents pulldown menu to show all Fire or all Rescue for a broader span of dates.
- Auto zoom (if left in the default ON mode) adjusts your view of the map to the results of your report query.
-
The Map Legend is symbolized using the Final NFIRS Code's first digit that identifies the NFIRS 'Group' category, 1 - 9.
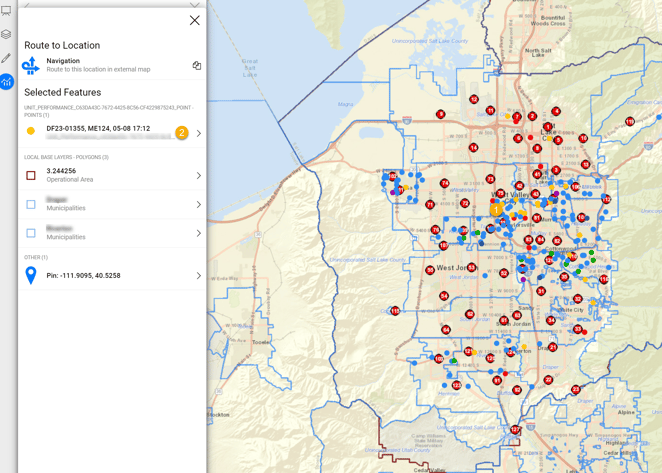
See How an Individual Incident Affected Response
- Click on an incident.
- Select the incident from the Info Panel to view additional details.
Understanding Performance Reports
- Unit Performance
- The TURNOUT donut chart represents the preparatory timeframe between when the unit is dispatched and when the unit goes enroute (physically departing the location).
- The TRAVEL donut chart represents the timeframe between when units go en route until arrival on scene.
- Incident Performance
- The ALARM donut chart represents the timeframe between the receipt of the 911 call to the dispatch of the first responding unit.
- The TOTAL donut chart represents the timeframe between the receipt of the 911 call to the first responding unit's arrival on scene.