MitiTrack is designed to document and track mitigations.
MitiTrack Community Risk Manager is a simple tool for adding, editing and updating landscape treatments that allows users to easily enter and manage map data. It supports Community Risk & Resilience efforts and utilizes the Fire Adapted Communities initiative as a framework for the many activities that constitute risk management and mitigation that build stronger communities. The Community Risk Manager Dashboard provides an interactive report on landscape and wildfire resilience stewardship.
<< Check out the video >>
BETA - A Community Wildfire Resilience (CWR) Participant group that was formed to help Intterra and Western Fire Chief's Association build a pool of feedback related to Fuels Mitigation and reporting needs. At this time, we have enabled the Fuels Mitigation Beta Layer and basic reporting tools in the participants local Intterra solution.
Below is a description of the layers and tools available in a new Risk Manager (CRM) workspace for the participants.
Layers
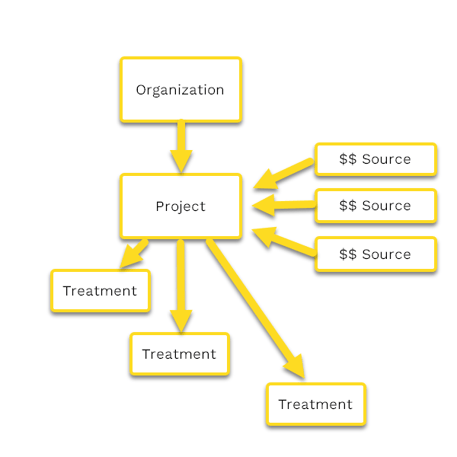
The Community Risk Manager layers provide organizations the ability to collect and track data commonly needed for reporting - projects, responsible organizations and funding sources, and treatments.

Organization
This layer is a point layer that stores information about your organization. The suggested placement for this point is at your agency’s headquarters.
This layer can also be used to track organizations that you may be providing funding to. For example, a county may be giving grants to cities within the county for mitigation work. The county could enter organization points for each city.
The organization layer primarily supports the connection of entities, funding and projects and facilitates the use of data in other applications such as reporting and dashboards.
Funding Sources
The Funding Sources layer is how different grants and funding is tracked. As you add a Funding Source point to the map, this creates a record that can be tied to an Organization and Project.
Like the Organization layer, it’s primary function is to support the connection between Organizations and Projects and enable reporting functionality.
A suggestion for entering Funding Source points is to locate an area just outside your agency and just make ‘list’ of them on the map. The placement of them does not need to be near the Organization or Project map features, as they are mostly used to connect data together in the database.
Project Areas
The Project Areas layer is where you will enter the boundaries of various projects you are managing. Ideally, every treatment will be associated with a Project Area. So whether there is one treatment or many treatments being done, they will be tied to a Project Area.
When you add a Project Area to the map, you should associate it with the appropriate Organization and add any Funding Sources being used to support the project or treatments within the project.
Treatments
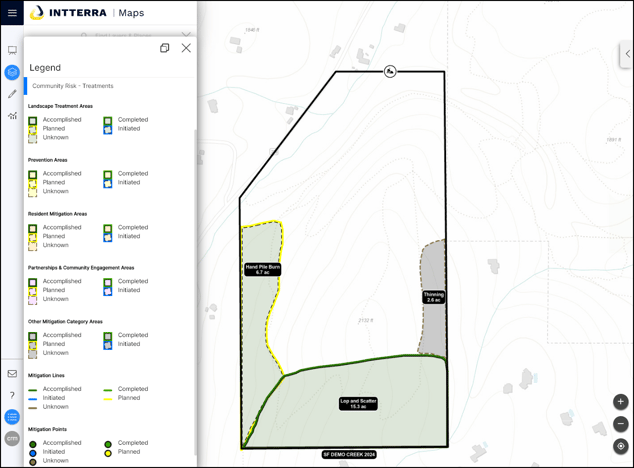
These layers are where you will document the treatment activities being done in each Project. You can add Treatments as an Area, Line or Point depending on which shape best represents the activity spatially.
Treatment should be associated with a Project. This will automatically associate it with the Organization and Funding Sources tied to the Project.

Tools
Three types of tools are provided for the BETA.
Community Risk Manager Dashboard -
Click here for more information.
Interactive Tables
Interactive Tables are used in Intterra to see your organization's CRM data displayed in an interactive table alongside those items located on a map. The data can be viewed, sorted, filtered, and exported to share with others. For a full description of how to use Interactive Tables, check out this article.
Interactive Tables are included to view each of the layer's data:
- Organization Table
- Funding Source Table
- Project Table
- Treatment - Points Table
- Treatment - Line Table
- Treatment - Areas Table
The Interactive Tables are great for the following tasks:
- Drill into your data in a table view with sort and filtering.
- Interact between Table and Map.
- Export the data for use in external applications.
Treatment List
This tool provides a list view of all CRM Treatments - points, lines, and areas - that can be used to zoom to an treatment. Managers can rename and delete (archive) all mapped features associated with a treatment. Here is an article on how this tool is used for incidents data - different data but the same tool.
The Treatment List is great for the following tasks:
- Renaming and archiving treatments - Renaming and archiving with affect all the records that share the same name since the tools aggregates all records with the same treatment name.
- Finding and zooming to treatments, regardless of type - points, lines, or areas.
References
